Market Outlook
December 14, 2016
Market Cues
Domestic Indices
Chg (%)
(Pts)
(Close)
Indian markets are expected to open flat tracking the SGX Nifty.
BSE Sensex
0.7
183
26,698
US Markets moved mostly higher during trading on Tuesday, extending the upward
Nifty
0.6
51
8,222
trend seen over the past several weeks. With the advance, all three of the major
Mid Cap
(0.4)
(54)
12,342
averages reached new record closing highs. The markets continued to benefit from
Small Cap
(0.1)
(8)
12,223
recent upward momentum amid optimism following President-elect Donald Trump's
Bankex
0.5
102
21,156
surprise victory last month.
European markets closed higher on Tuesday as investors focused on the upcoming
Global Indices
Chg (%)
(Pts)
(Close)
meeting of the Federal Reserve and digested better-than-expected data out from
Dow Jones
0.6
115
19,911
China.
Nasdaq
0.9
51
5,464
Indian markets closed higher on Tuesday after seeing initial volatility. However,
FTSE
1.1
78
6,969
caution prevailed ahead of the U.S. Federal Reserve's monetary policy decision on
Wednesday. The Fed is widely expected to increase interest rates by 25 basis points,
Nikkei
(0.1)
(26)
19,225
reflecting the first rate hike in a year.
Hang Seng
0.7
161
22,608
Shanghai Com
(0.0)
(0)
3,155
News Analysis
Delay in Halol plant resolution to hurt Sun Pharma's FY18 profit
Advances / Declines
BSE
NSE
Detailed analysis on Pg2
Advances
1,301
786
Investor’s Ready Reckoner
Declines
1,317
824
Key Domestic & Global Indicators
Unchanged
176
81
Stock Watch: Latest investment recommendations on 150+ stocks
Refer Pg5 onwards
Volumes (` Cr)
BSE
2,060
Top Picks
CMP
Target
Upside
NSE
18,049
Company
Sector
Rating
(`)
(`)
(%)
Amara Raja Batt. Auto & Auto Ancill.
Buy
906
1,167
28.8
Net Inflows (` Cr)
Net
Mtd
Ytd
Alkem Laboratories Pharmaceuticals
Buy
1,640
1,989
21.3
HCL Tech
IT
Buy
800
1,000
25.0
FII
334
833
28,110
Power Grid Corp. Power
Buy
185
223
20.4
MFs
(222)
411
38,596
Navkar Corp.
Others
Buy
175
265
51.4
More Top Picks on Pg3
Top Gainers
Price (`)
Chg (%)
Key Upcoming Events
Den
75
17.4
Previous
Consensus
Date
Region
Event Description
Mindtree
492
5.1
Reading
Expectations
Ktkbank
113
4.9
Dec 14 UK
Jobless claims change
9.80
6.50
Dec 14 India
Monthly Wholesale Prices YoY%
3.39
3.10
Tvsmotor
382
4.3
Dec 14 US
Industrial Production
0.04
(0.20)
Jindalstel
76
3.8
Dec 13 US
Producer Price Index (mom)
0.40
-
More Events on Pg4
Top Losers
Price (`)
Chg (%)
Vakrangee
269
(5.5)
Ramcocem
533
(5.0)
Bergepaint
200
(4.2)
Kajariacer
482
(3.9)
Cholafin
835
(3.7)
As on December 14, 2016
Market Outlook
December 14, 2016
News Analysis
Delay in Halol plant resolution to hurt Sun Pharma's FY18 profit
A delay in resolution of quality control issues at the Halol plant will adversely
impact Sun Pharma's FY18 profit. Halol plant is key for Sun Pharma and it
contributed in high single digits to its US sales before it was issued a warning letter
last December. Last week the FDA raised fresh concerns about the plant following
an inspection. The violations listed by the FDA after its latest inspection at Halol
include problems with Sun's quality control system, some of which were also cited
by the U.S. health regulator in its warning letter issued to Sun in December 2015.
They also listed a lack of proper maintenance of important records related to the
manufacturing process and cited concerns about the accuracy of some of the drug
testing methods employed. Other findings included delays in informing the agency
of contamination or failure of drug batches. The Halol plant has been under
regulatory scanner since September 2014 when it received 483 observations.
Subsequently, no new product approvals have been granted from the plant.
Remediation measures undertaken to restore compliance also hit supplies from the
plant impacting the overall sales. Following the issuance of warning letter last
December, Sun Pharma managing director Dilip Shanghvi had indicated that the
company's main focus would be to restore compliance rather than site transfers
(that is shifting production to other facilities).
Sun Pharma has hired third-party consultants and senior professionals in quality
and compliance apart from investing in technology as a part of remediation
efforts.
Economic and Political News
Demonetisation pain may reduce by Jan 10; FM hints at tax cut
Nov CPI inflation cools to two-year low of 3.63%
Q2 current account deficit at 0.6% of GDP
Corporate News
Tata Sons buys 1.73% stake in Tata Motors
Singh brothers may sell 26% stake in Fortis: Reports
NTPC enters wind power space, partners with Inox Wind
Market Outlook
December 14, 2016
Top Picks ★★★★★
Large Cap
Market Cap
CMP
Target
Upside
Company
Rationale
(` Cr)
(`)
(`)
(%)
To outpace battery industry growth due to better
Amara Raja Batteries
15,478
906
1,167
28.8
technological products leading to market share gains in
both the automotive OEM and replacement segments.
Strong growth in domestic business due to its leadership in
Alkem Laboratories
19,609
1,640
1,989
21.3
acute therapeutic segment. Alkem expects to launch more
products in USA, which bodes for its international business.
The stock is trading at attractive valuations and is factoring
HCL Tech
1,12,825
800
1,000
25.0
all the bad news.
Back on the growth trend; expect a long term growth of 14%
Infosys
2,27,409
990
1,249
26.1
to be a US$20bn in FY2020.
Strong order backlog and improvement in execution would
Larsen & Tourbo
1,28,188
1,375
1,634
18.8
trigger the growth for the L&T
One of the largest pharma companies with strong
international presence. It has a rich pipeline of ANDAs
Lupin
67,270
1,492
1,809
21.2
which is also one of the largest among the generic
companies.
Going forward, we expect the company to report strong
Power Grid Corporation
96,889
185
223
20.4
top-line CAGR of ~16% and bottom-line CAGR of ~19%
over FY16-18 on back of strong capitalization guidance
Source: Company, Angel Research
Mid Cap
Market Cap
CMP
Target
Upside
Company
Rationale
(` Cr)
(`)
(`)
(%)
We expect the company would report strong profitability
Asian Granito
642
214
351
64.4
owing to better product mix, higher B2C sales and
amalgamation synergy.
Among the top 4 players in the consumer durables segment.
Bajaj Electricals
2,201
218
274
25.7
Improved profitability backed by turn around in E&P
segment. Strong order book lends earnings visibility.
Favourable outlook for AC industry augurs well for Cooling
Blue Star
4,529
475
634
33.5
products business which is outgrowing the market. EMPPAC
division's is likely to turn around on improving economy
With a focus on the low and medium income (LMI)
Dewan Housing Finance
7,686
246
350
42.5
consumer segment, the company has increased its presence
in tier-II & III cities where the growth opportunity is immense.
Strong loan growth backed by diversified loan portfolio and
adequate CAR. ROE & ROA likely to remain decent as risk of
Equitas Holdings
5,119
153
235
53.9
dilution remains low. Attractive valuations considering
growth.
Economic recovery to have favourable impact on advertising
& circulation revenue growth. Further, the acquisition of a
Jagran Prakashan
5,562
170
225
32.2
radio business (Radio City) would also boost the company's
revenue growth.
Speedier execution and speedier sales, strong revenue
Mahindra Lifespace
1,500
366
522
42.8
visibilty in short-to-long run, attractive valuations
We expect the company to report strong growth on back of
healthy growth in domestic branded sales (owing to
Mirza International
997
83
107
29.1
aggressive ad spend and addition in the number of EBOs &
multi-brand outlets [MBOs]) and healthy export revenues.
Massive capacity expansion along with rail advantage at
Navkar Corporation
2,496
175
265
51.4
ICD as well CFS augurs well for the company.
Strong brands and distribution network would boost growth
Siyaram Silk Mills
1,167
1,245
1,605
29.0
going ahead. Stock currently trades at an inexpensive
valuation.
Market leadership in Hindi news genre and no. 2 viewership
ranking in English news genre, exit from the radio business,
TV Today Network
1,678
281
385
36.9
and anticipated growth in ad spends by corporate to benefit
the stock.
Source: Company, Angel Research
Market Outlook
December 14, 2016
Key Upcoming Events
Global economic events release calendar
Bloomberg Data
Date
Time
Country
Event Description
Unit
Period
Last Reported
Estimated
Dec 13, 2016
India
Imports YoY%
% Change Nov
8.10
India
Exports YoY%
% Change Nov
9.59
7:30 AM
China
Industrial Production (YoY)
% Change Nov
6.10
6.10
3:00 PM
UK
CPI (YoY)
% Change Nov
0.90
1.10
Dec 14, 2016
3:00 PM
UK
Jobless claims change
% Change Nov
9.80
6.50
12:00 PM
India Monthly Wholesale Prices YoY%
% Change Nov
3.39
3.10
7:45 PM
US
Industrial Production
% Nov
0.04
(0.20)
US
Producer Price Index (mom)
% Change Nov
0.40
Dec 15, 2016
7:00 PM
US
Initial Jobless claims
Thousands
Dec 10
258.00
255.00
2:00 PM
Germany
PMI Services
Value Dec P
55.10
54.90
2:00 PM
Germany
PMI Manufacturing
Value Dec P
54.30
54.50
7:00 PM
US Consumer price index (mom)
% Change Nov
0.40
0.20
5:30 PM
UK
BOE Announces rates
% Ratio
Dec 15
0.25
0.25
12:30 AM
US
FOMC rate decision
%
Dec 14
0.50
0.75
Dec 16, 2016
7:00 PM
US
Housing Starts
Thousands
Nov
1,323.00
1,230.00
7:00 PM
US
Building permits
Thousands
Nov
1,260.00
1,236.00
3:30 PM Euro Zone
Euro-Zone CPI (YoY)
% Nov F
0.60
0.60
Dec 21, 2016
8:30 PM
US
Existing home sales
Million
Nov
5.60
5.50
8:30 PM Euro ZoneEuro-Zone Consumer Confidence
Value Dec A
(6.10)
Dec 22, 2016
7:00 PM
US
GDP Qoq (Annualised)
% Change 3Q T
3.20
3.30
Dec 23, 2016
3:00 PM
UK
GDP (YoY)
% Change 3Q F
2.30
8:30 PM
US
New home sales
Thousands
Nov
563.00
575.00
Dec 27, 2016
8:30 PM
US
Consumer ConfidenceS.A./ 1985=100
Dec
107.10
Jan 01, 2017
6:30 AM
China
PMI Manufacturing
Value
Dec
51.70
Jan 03, 2017
3:00 PM
UK
PMI Manufacturing
Value
Dec
53.40
2:25 PM
Germany Unemployment change (000's)
Thousands
Dec
(5.00)
Jan 06, 2017
7:00 PM
US
Change in Nonfarm payrolls
Thousands
Dec
178.00
Source: Bloomberg, Angel Research
Market Outlook
December 14, 2016
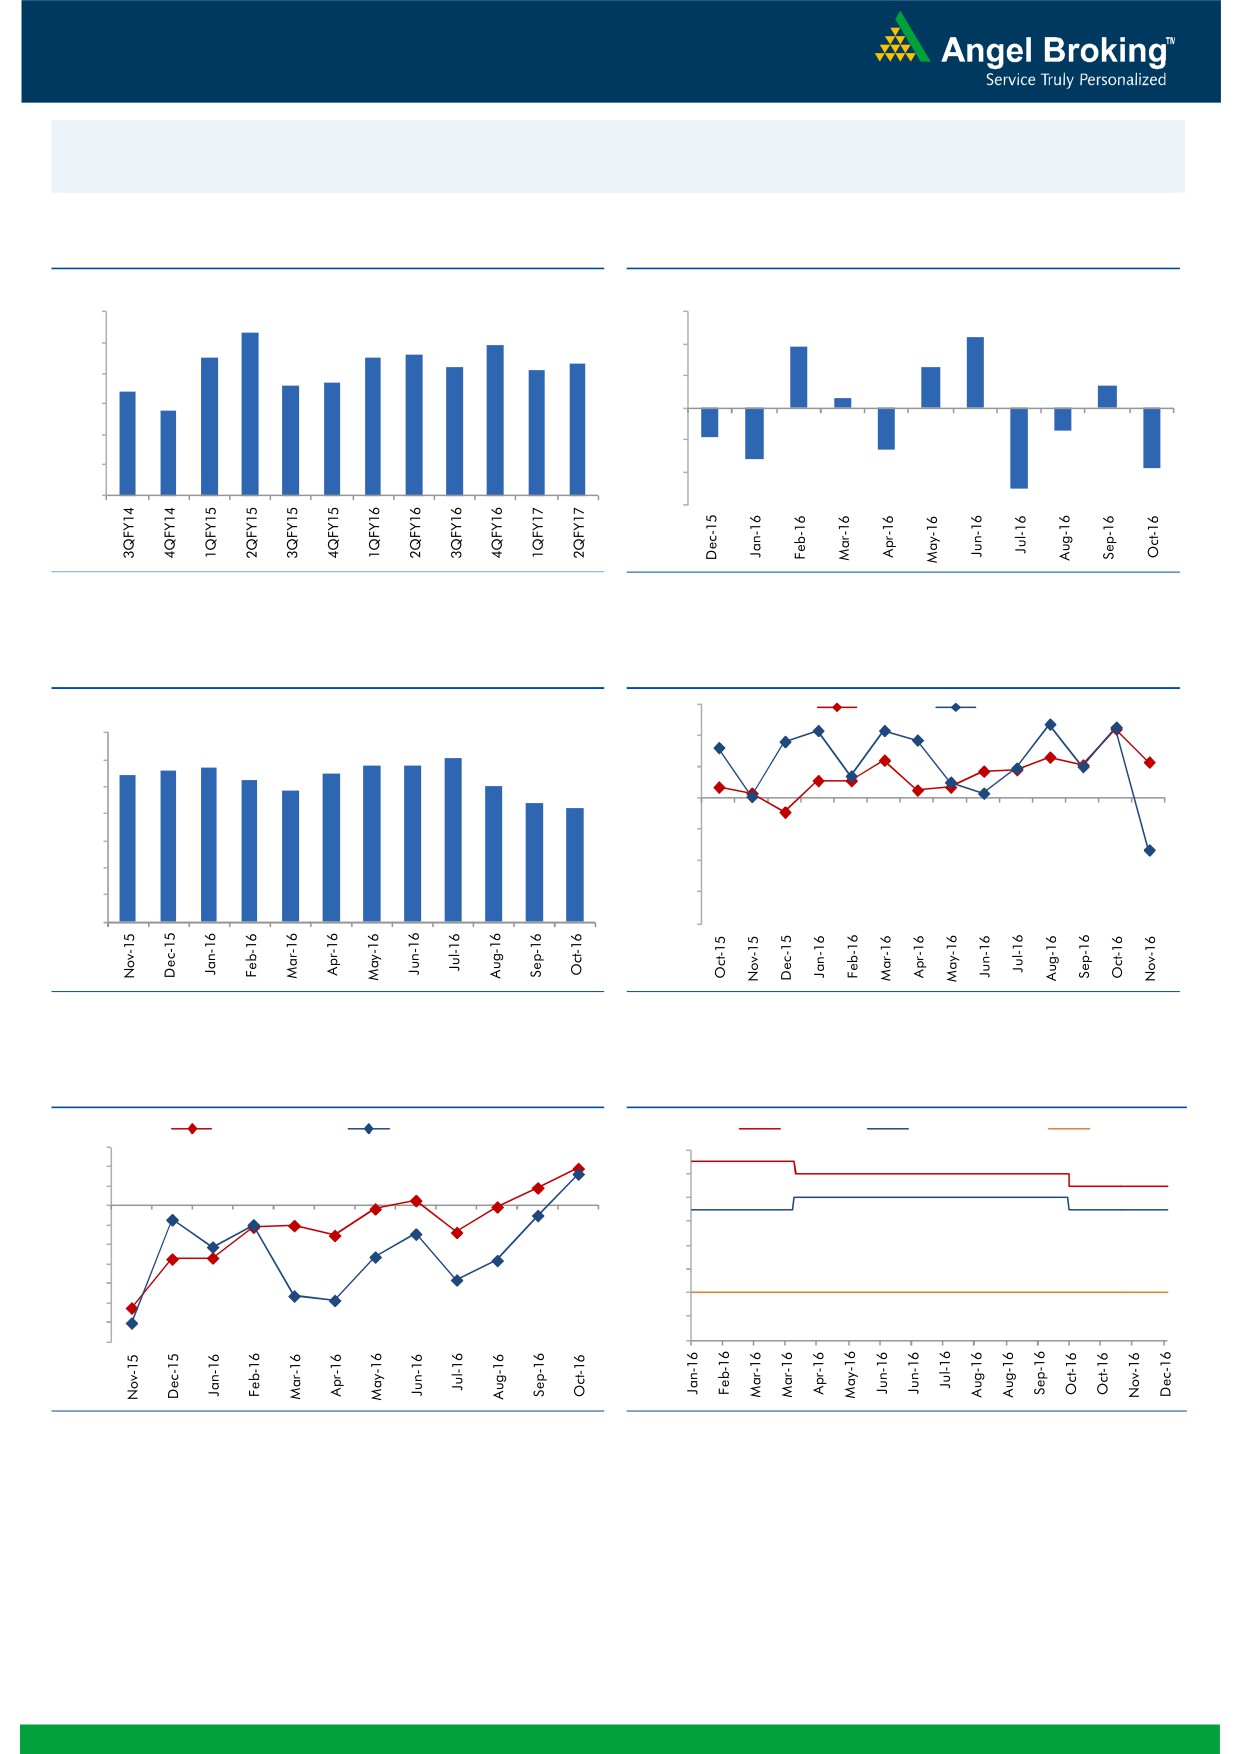
Macro watch
Exhibit 1: Quarterly GDP trends
Exhibit 2: IIP trends
(%)
(%)
9.0
8.3
3.0
2.2
7.9
1.9
7.5
7.5
7.6
8.0
2.0
7.2
7.1
7.3
1.3
6.6
6.7
0.7
7.0
6.4
1.0
0.3
5.8
6.0
-
5.0
(1.0)
(0.7)
(0.9)
4.0
(1.3)
(2.0)
(1.6)
(1.9)
3.0
(3.0)
(2.5)
Source: CSO, Angel Research
Source: MOSPI, Angel Research
Exhibit 3: Monthly CPI inflation trends
Exhibit 4: Manufacturing and services PMI
56.0
Mfg. PMI
Services PMI
(%)
7.0
54.0
6.1
5.6
5.7
5.8
5.8
6.0
5.4
5.5
5.3
5.1
52.0
4.8
5.0
4.4
4.2
50.0
4.0
48.0
3.0
46.0
2.0
1.0
44.0
-
42.0
Source: MOSPI, Angel Research
Source: Market, Angel Research; Note: Level above 50 indicates expansion
Exhibit 5: Exports and imports growth trends
Exhibit 6: Key policy rates
(%)
Exports yoy growth
Imports yoy growth
(%)
Repo rate
Reverse Repo rate
CRR
15.0
7.00
10.0
6.50
5.0
6.00
0.0
(5.0)
5.50
(10.0)
5.00
(15.0)
4.50
(20.0)
4.00
(25.0)
3.50
(30.0)
(35.0)
3.00
Source: Bloomberg, Angel Research
Source: RBI, Angel Research
Market Outlook
December 14, 2016
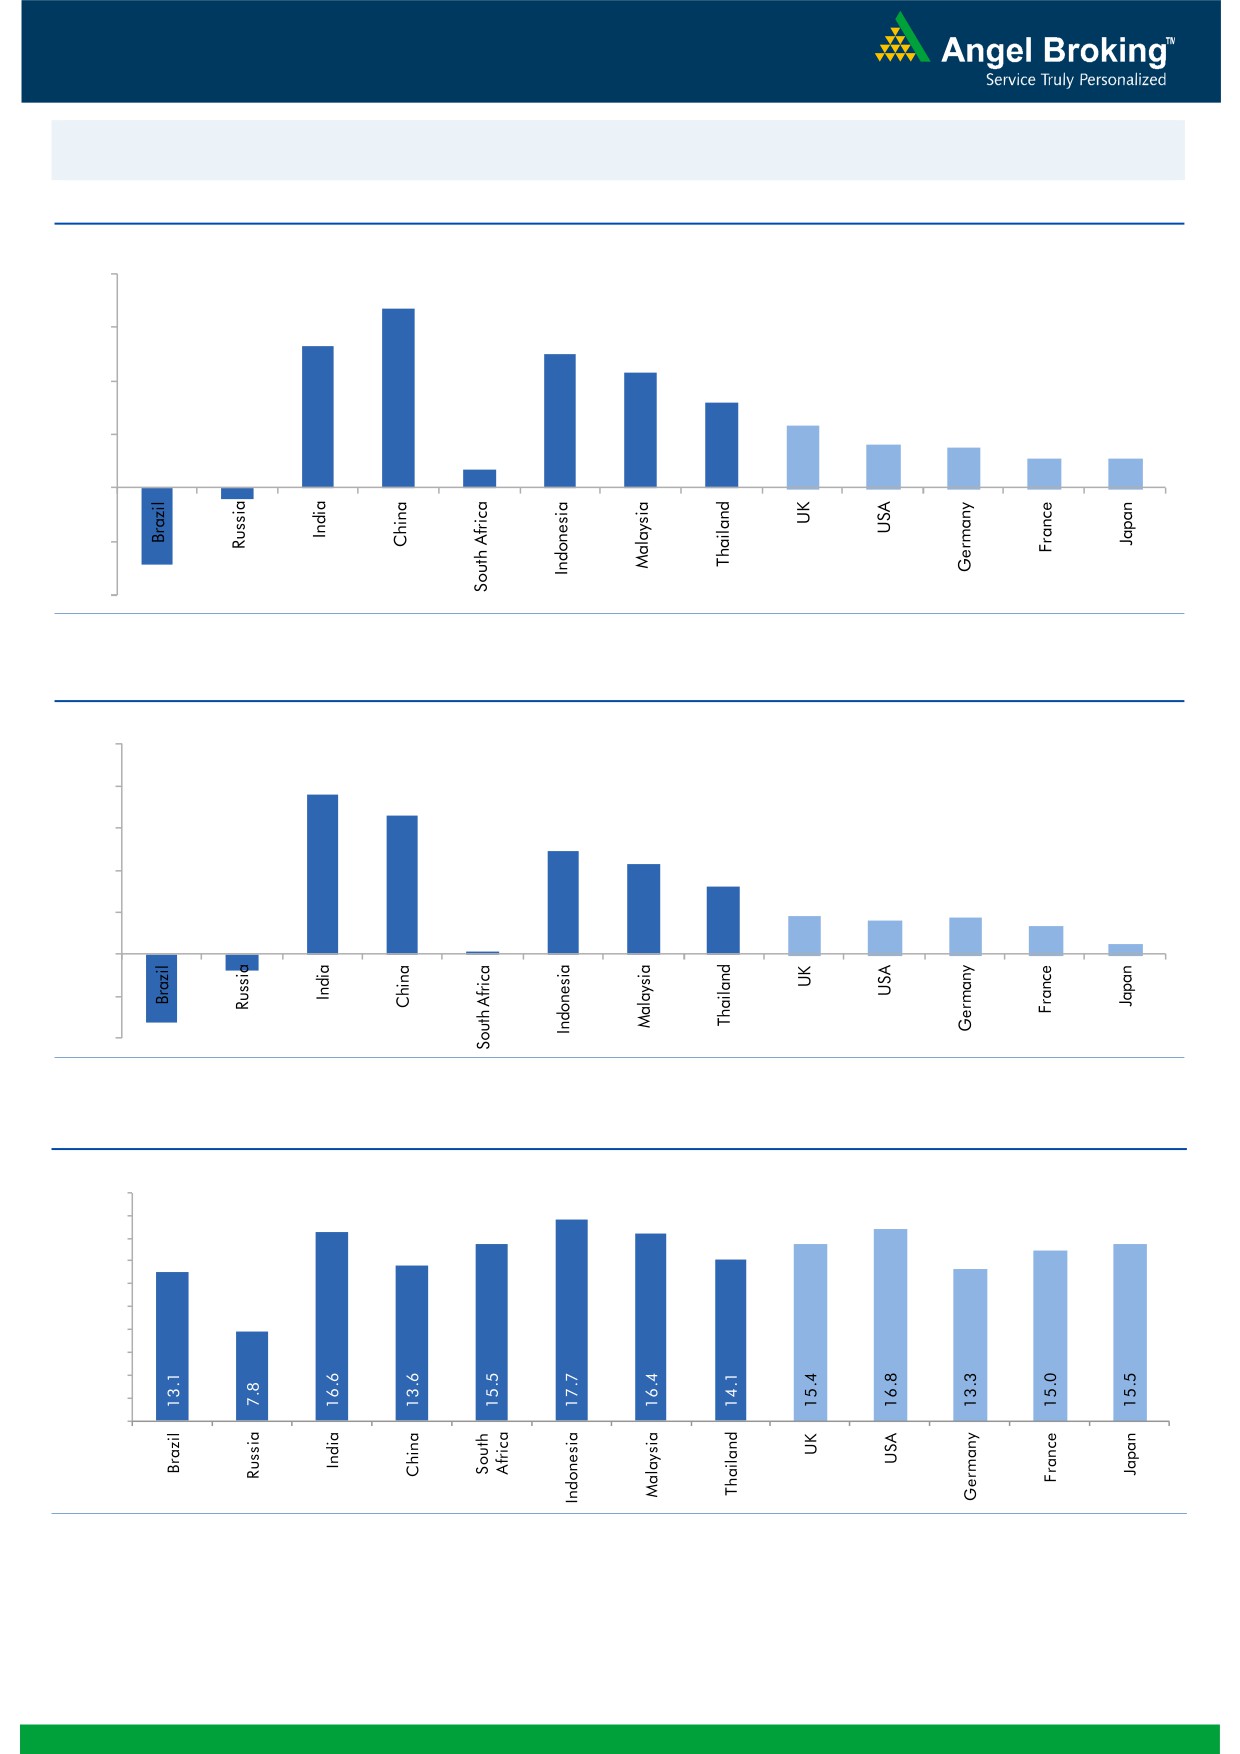
Global watch
Exhibit 1: Latest quarterly GDP Growth (%, yoy) across select developing and developed countries
(%)
8.0
6.7
5.3
6.0
5.0
0.7
4.3
4.0
3.2
2.3
1.6
1.5
2.0
1.1
1.1
-
(2.0)
(0.4)
(2.9)
(4.0)
Source: Bloomberg, Angel Research
Exhibit 2: 2016 GDP Growth projection by IMF (%, yoy) across select developing and developed countries
(%)
10.0
7.6
8.0
6.6
6.0
4.9
4.3
4.0
3.2
1.8
1.7
1.6
1.3
2.0
(0.8)
0.5
(3.3)
0.1
-
(2.0)
(4.0)
Source: IMF, Angel Research
Exhibit 3: One year forward P-E ratio across select developing and developed countries
(x)
20.0
18.0
16.0
14.0
12.0
10.0
8.0
6.0
4.0
2.0
-
Source: IMF, Angel Research
Market Outlook
December 14, 2016
Exhibit 4: Relative performance of indices across globe
Returns (%)
Country
Name of index
Closing price
1M
3M
1YR
Brazil
Bovespa
59,281
(5.7)
0.6
33.4
Russia
Micex
2,247
8.6
9.9
28.1
India
Nifty
8,222
(3.1)
(8.4)
5.0
China
Shanghai Composite
3,155
(0.6)
2.8
(10.9)
South Africa
Top 40
44,171
(1.6)
(4.3)
0.1
Mexico
Mexbol
46,870
(3.2)
(1.0)
11.7
Indonesia
LQ45
890
(3.4)
(1.8)
13.3
Malaysia
KLCI
1,645
(0.5)
(2.7)
(1.4)
Thailand
SET 50
957
0.9
2.9
9.4
USA
Dow Jones
19,911
7.8
9.2
14.4
UK
FTSE
6,969
3.5
4.4
15.0
Japan
Nikkei
19,251
11.0
13.2
(3.5)
Germany
DAX
11,285
5.1
7.1
6.9
France
CAC
4,804
5.1
8.5
4.3
Source: Bloomberg, Angel Research
Stock Watch
December 14, 2016
Company Name
Reco
CMP
Target
Mkt Cap
Sales ( Čcr )
OPM(%)
EPS (Č)
PER(x)
P/BV(x)
RoE(%)
EV/Sales(x)
(Č)
Price ( Č)
( Č cr )
FY17E FY18E
FY17E
FY18E
FY17E
FY18E
FY17E
FY18E
FY17E
FY18E
FY17E
FY18E
FY17E
FY18E
Agri / Agri Chemical
Rallis
Neutral
203
-
3,939
1,937
2,164
13.3
14.3
9.0
11.0
22.5
18.4
3.9
3.4
18.4
19.8
2.0
1.8
United Phosphorus
Neutral
679
-
34,443
15,176
17,604
18.5
18.5
37.4
44.6
18.2
15.2
3.6
3.0
21.4
21.2
2.4
2.1
Auto & Auto Ancillary
Ashok Leyland
Buy
78
111
22,184
22,407
26,022
10.6
10.6
5.2
6.4
14.9
12.1
3.4
2.9
23.6
24.7
1.1
0.9
Bajaj Auto
Neutral
2,659
-
76,954
25,093
27,891
19.5
19.2
143.9
162.5
18.5
16.4
5.2
4.5
30.3
29.4
2.8
2.4
Bharat Forge
Neutral
998
-
23,228
7,726
8,713
20.5
21.2
35.3
42.7
28.3
23.4
5.2
4.7
18.9
20.1
3.0
2.6
Eicher Motors
Neutral
22,334
-
60,662
16,583
20,447
17.5
18.0
598.0
745.2
37.4
30.0
12.8
9.7
41.2
38.3
3.5
2.7
Gabriel India
Buy
108
130
1,550
1,544
1,715
9.0
9.3
5.4
6.3
20.0
17.1
3.8
3.3
18.9
19.5
1.0
0.8
Hero Motocorp
Accumulate
3,202
3,541
63,939
30,958
34,139
15.7
15.7
193.6
208.3
16.5
15.4
6.5
5.4
34.2
30.5
1.9
1.7
Jamna Auto Industries Neutral
170
-
1,356
1,486
1,620
9.8
9.9
15.0
17.2
11.3
9.9
2.5
2.1
21.8
21.3
1.0
0.9
L G Balakrishnan & Bros Neutral
596
-
935
1,302
1,432
11.6
11.9
43.7
53.0
13.6
11.3
1.9
1.8
13.8
14.2
0.8
0.7
Mahindra and Mahindra Neutral
1,169
-
72,587
46,534
53,077
11.6
11.7
67.3
78.1
17.4
15.0
2.8
2.5
15.4
15.8
1.5
1.3
Maruti
Buy
5,161
6,006
155,899
68,057
82,958
15.8
15.5
212.1
261.2
24.3
19.8
4.8
4.0
19.8
20.3
2.0
1.5
Minda Industries
Neutral
311
-
2,465
2,728
3,042
9.0
9.1
68.2
86.2
4.6
3.6
1.0
0.8
23.8
24.3
1.0
0.8
Motherson Sumi
Neutral
326
-
45,772
45,896
53,687
7.8
8.3
13.0
16.1
25.0
20.3
8.1
6.4
34.7
35.4
1.1
0.9
Rane Brake Lining
Neutral
1,010
-
799
511
562
11.3
11.5
28.1
30.9
35.9
32.7
5.5
5.0
15.3
15.0
1.7
1.5
Setco Automotive
Neutral
36
-
478
741
837
13.0
13.0
15.2
17.0
2.4
2.1
0.4
0.4
15.8
16.3
1.0
0.9
Tata Motors
Neutral
470
-
135,800
300,209
338,549
8.9
8.4
42.7
54.3
11.0
8.7
1.8
1.5
15.6
17.2
0.6
0.5
TVS Motor
Neutral
382
-
18,146
13,390
15,948
6.9
7.1
12.8
16.5
29.9
23.1
7.4
5.9
26.3
27.2
1.3
1.1
Amara Raja Batteries
Buy
906
1,167
15,478
5,504
6,605
17.6
17.5
33.4
40.9
27.1
22.2
6.0
4.9
22.1
22.0
2.8
2.3
Exide Industries
Neutral
173
-
14,675
7,439
8,307
15.0
15.0
8.1
9.3
21.3
18.6
3.0
2.7
14.3
16.7
1.6
1.4
Apollo Tyres
Buy
197
235
10,023
12,877
14,504
14.3
13.9
21.4
23.0
9.2
8.6
1.4
1.2
16.4
15.2
0.9
0.9
Ceat
Buy
1,251
1,450
5,061
7,524
8,624
13.0
12.7
131.1
144.3
9.5
8.7
1.8
1.5
19.8
18.6
0.7
0.7
JK Tyres
Neutral
119
-
2,701
7,455
8,056
15.0
15.0
21.8
24.5
5.5
4.9
1.1
0.9
22.8
21.3
0.5
0.4
Swaraj Engines
Neutral
1,360
-
1,689
660
810
15.2
16.4
54.5
72.8
25.0
18.7
7.8
7.1
31.5
39.2
2.3
1.9
Subros
Neutral
164
-
986
1,488
1,681
11.7
11.9
6.4
7.2
25.7
22.9
2.7
2.5
10.8
11.4
0.9
0.8
Indag Rubber
Neutral
181
-
476
286
326
19.8
16.8
11.7
13.3
15.5
13.6
2.6
2.5
17.8
17.1
1.3
1.2
Capital Goods
ACE
Neutral
49
-
487
709
814
4.1
4.6
1.4
2.1
35.1
23.4
1.5
1.4
4.4
6.0
0.8
0.7
BEML
Neutral
912
-
3,799
3,451
4,055
6.3
9.2
31.4
57.9
29.1
15.8
1.7
1.6
6.3
10.9
1.2
1.0
Bharat Electronics
Neutral
1,474
-
32,916
8,137
9,169
16.8
17.2
58.7
62.5
25.1
23.6
3.9
3.5
44.6
46.3
3.1
2.8
Stock Watch
December 14, 2016
Company Name
Reco
CMP
Target
Mkt Cap
Sales ( Čcr )
OPM(%)
EPS (Č)
PER(x)
P/BV(x)
RoE(%)
EV/Sales(x)
(Č)
Price ( Č)
( Č cr )
FY17E
FY18E
FY17E
FY18E
FY17E
FY18E
FY17E
FY18E
FY17E
FY18E
FY17E
FY18E
FY17E
FY18E
Capital Goods
Voltas
Buy
321
407
10,607
6,511
7,514
7.9
8.7
12.9
16.3
24.9
19.7
4.5
3.9
16.7
18.5
1.4
1.2
BGR Energy
Neutral
117
-
845
16,567
33,848
6.0
5.6
7.8
5.9
15.0
19.9
0.9
0.8
4.7
4.2
0.2
0.1
BHEL
Neutral
126
-
30,779
28,797
34,742
-
2.8
2.3
6.9
54.7
18.2
0.9
0.9
1.3
4.8
0.7
0.5
Blue Star
Buy
475
634
4,529
4,283
5,077
5.9
7.3
14.9
22.1
31.9
21.5
6.2
5.2
20.4
26.4
1.1
0.9
Crompton Greaves
Neutral
60
-
3,764
5,777
6,120
5.9
7.0
3.3
4.5
18.2
13.3
0.8
0.8
4.4
5.9
0.6
0.5
Greaves Cotton
Neutral
126
-
3,066
1,755
1,881
16.8
16.9
7.8
8.5
16.1
14.8
3.2
3.0
20.6
20.9
1.4
1.3
Inox Wind
Neutral
205
-
4,544
5,605
6,267
15.7
16.4
24.8
30.0
8.3
6.8
2.3
1.7
25.9
24.4
0.8
0.7
KEC International
Neutral
139
-
3,574
9,294
10,186
7.9
8.1
9.9
11.9
14.0
11.7
2.1
1.8
15.6
16.3
0.6
0.6
Thermax
Neutral
825
-
9,833
5,421
5,940
7.3
7.3
25.7
30.2
32.1
27.3
3.9
3.6
12.2
13.1
1.7
1.6
VATech Wabag
Buy
483
681
2,631
3,136
3,845
8.9
9.1
26.0
35.9
18.6
13.4
2.3
2.0
13.4
15.9
0.7
0.6
Cement
ACC
Neutral
1,337
-
25,102
11,225
13,172
13.2
16.9
44.5
75.5
30.0
17.7
2.8
2.6
11.2
14.2
2.3
1.9
Ambuja Cements
Neutral
207
-
41,023
9,350
10,979
18.2
22.5
5.8
9.5
35.6
21.8
3.0
2.7
10.2
12.5
4.4
3.8
India Cements
Neutral
116
-
3,566
4,364
4,997
18.5
19.2
7.9
11.3
14.7
10.3
1.1
1.0
8.0
8.5
1.6
1.4
JK Cement
Neutral
713
-
4,989
4,398
5,173
15.5
17.5
31.2
55.5
22.9
12.9
2.7
2.4
12.0
15.5
1.7
1.4
J K Lakshmi Cement
Buy
360
565
4,237
2,913
3,412
14.5
19.5
7.5
22.5
48.0
16.0
3.0
2.5
12.5
18.0
2.1
1.7
Orient Cement
Buy
130
215
2,663
2,114
2,558
18.5
20.5
8.1
11.3
16.1
11.5
2.4
2.0
9.0
14.0
1.9
1.5
UltraTech Cement
Neutral
3,363
-
92,295
25,768
30,385
21.0
23.5
111.0
160.0
30.3
21.0
3.9
3.4
13.5
15.8
3.8
3.1
Construction
ITNL
Neutral
103
-
3,397
8,946
10,017
31.0
31.6
8.1
9.1
12.8
11.4
0.5
0.5
4.2
5.0
3.7
3.4
KNR Constructions
Neutral
171
-
2,400
1,385
1,673
14.7
14.0
41.2
48.5
4.1
3.5
0.8
0.7
14.9
15.2
1.7
1.4
Larsen & Toubro
Buy
1,375
1,634
128,188
111,017
124,908
11.0
11.0
61.1
66.7
22.5
20.6
2.7
2.5
13.1
12.9
2.2
2.0
Gujarat Pipavav Port
Neutral
140
-
6,754
705
788
52.2
51.7
5.0
5.6
27.9
25.0
2.8
2.5
11.2
11.2
9.1
7.7
Nagarjuna Const.
Neutral
83
-
4,620
8,842
9,775
9.1
8.8
5.3
6.4
15.7
13.0
1.2
1.1
8.2
9.1
0.7
0.6
PNC Infratech
Buy
105
143
2,682
2,350
2,904
13.1
13.2
9.0
8.8
11.6
11.9
0.4
0.4
15.9
13.9
1.3
1.0
Simplex Infra
Neutral
287
-
1,418
6,829
7,954
10.5
10.5
31.4
37.4
9.1
7.7
1.0
0.9
9.9
13.4
0.6
0.5
Power Mech Projects
Neutral
463
-
682
1,801
2,219
12.7
14.6
72.1
113.9
6.4
4.1
1.2
1.0
16.8
11.9
0.4
0.3
Sadbhav Engineering
Accumulate
275
298
4,710
3,598
4,140
10.3
10.6
9.0
11.9
30.5
23.1
3.2
2.8
9.9
11.9
1.6
1.3
NBCC
Neutral
228
-
13,650
7,428
9,549
7.9
8.6
8.2
11.0
27.7
20.7
1.4
1.1
28.2
28.7
1.6
1.2
MEP Infra
Neutral
39
-
638
1,877
1,943
30.6
29.8
3.0
4.2
13.1
9.4
6.3
4.3
0.6
0.6
1.7
1.5
SIPL
Neutral
93
-
3,258
1,036
1,252
65.5
66.2
(8.4)
(5.6)
3.5
4.0
(22.8)
(15.9)
11.3
9.4
Stock Watch
December 14, 2016
Company Name
Reco
CMP
Target
Mkt Cap
Sales ( Čcr )
OPM(%)
EPS (Č)
PER(x)
P/BV(x)
RoE(%)
EV/Sales(x)
(Č)
Price ( Č)
( Č cr )
FY17E
FY18E
FY17E
FY18E
FY17E
FY18E
FY17E
FY18E
FY17E
FY18E
FY17E
FY18E
FY17E
FY18E
Construction
Engineers India
Neutral
313
-
10,543
1,725
1,935
16.0
19.1
11.4
13.9
27.5
22.5
3.8
3.7
13.4
15.3
5.0
4.5
Financials
Axis Bank
Buy
452
630
107,965
46,932
53,575
3.5
3.4
32.4
44.6
14.0
10.1
1.8
1.6
13.6
16.5
-
-
Bank of Baroda
Neutral
160
-
36,959
19,980
23,178
1.8
1.8
11.5
17.3
14.0
9.3
1.6
1.3
8.3
10.1
-
-
Canara Bank
Neutral
305
-
16,559
15,225
16,836
1.8
1.8
14.5
28.0
21.0
10.9
1.5
1.2
5.8
8.5
-
-
Dewan Housing Finance Buy
246
350
7,686
2,225
2,688
2.9
2.9
29.7
34.6
8.3
7.1
1.3
1.1
16.1
16.8
-
-
Equitas Holdings
Buy
153
235
5,120
939
1,281
11.7
11.5
5.8
8.2
26.3
18.6
2.3
2.0
10.9
11.5
-
-
Federal Bank
Neutral
71
-
12,173
9,353
10,623
2.9
2.9
4.4
5.8
16.1
12.2
1.5
1.4
9.5
11.0
-
-
HDFC
Neutral
1,277
-
201,881
11,475
13,450
3.4
3.4
45.3
52.5
28.2
24.3
5.4
4.8
20.2
20.5
-
-
HDFC Bank
Accumulate
1,186
1,350
300,214
46,097
55,433
4.5
4.5
58.4
68.0
20.3
17.4
3.6
3.0
18.8
18.6
-
-
ICICI Bank
Buy
265
315
154,062
42,800
44,686
3.1
3.3
18.0
21.9
14.7
12.1
2.0
1.9
11.1
12.3
-
-
Lakshmi Vilas Bank
Buy
145
174
2,595
3,339
3,799
2.7
2.8
11.0
14.0
13.2
10.3
1.4
1.3
11.2
12.7
-
-
LIC Housing Finance
Accumulate
550
630
27,777
3,712
4,293
2.6
2.5
39.0
46.0
14.1
12.0
2.7
2.3
19.9
20.1
-
-
Punjab Natl.Bank
Neutral
129
-
27,547
23,532
23,595
2.3
2.4
6.8
12.6
19.0
10.3
2.9
2.1
3.3
6.5
-
-
RBL Bank
Neutral
345
-
12,740
1,783
2,309
2.6
2.6
12.7
16.4
27.1
21.0
3.0
2.6
12.8
13.3
-
-
South Ind.Bank
Neutral
22
-
2,964
6,435
7,578
2.5
2.5
2.7
3.1
8.1
7.1
1.1
0.9
10.1
11.2
-
-
St Bk of India
Neutral
266
-
206,102
88,650
98,335
2.6
2.6
13.5
18.8
19.7
14.1
1.9
1.6
7.0
8.5
-
-
Union Bank
Neutral
142
-
9,779
13,450
14,925
2.3
2.3
25.5
34.5
5.6
4.1
0.8
0.7
7.5
10.2
-
-
Yes Bank
Neutral
1,207
-
50,800
8,978
11,281
3.3
3.4
74.0
90.0
16.3
13.4
3.1
2.6
17.0
17.2
-
-
FMCG
Asian Paints
Neutral
909
-
87,186
17,128
18,978
16.8
16.4
19.1
20.7
47.6
43.9
16.6
15.6
34.8
35.5
5.0
4.5
Britannia
Buy
2,937
3,626
35,241
9,594
11,011
14.6
14.9
80.3
94.0
36.6
31.3
15.0
11.6
41.2
-
3.6
3.1
Colgate
Accumulate
913
995
24,830
4,605
5,149
23.4
23.4
23.8
26.9
38.4
33.9
21.2
16.6
64.8
66.8
5.3
4.7
Dabur India
Accumulate
281
304
49,441
8,315
9,405
19.8
20.7
8.1
9.2
34.7
30.6
9.7
8.0
31.6
31.0
5.5
4.8
GlaxoSmith Con*
Neutral
5,068
-
21,312
4,350
4,823
21.2
21.4
179.2
196.5
28.3
25.8
7.5
6.4
27.1
26.8
4.2
3.7
Godrej Consumer
Neutral
1,441
-
49,073
10,235
11,428
18.4
18.6
41.1
44.2
35.1
32.6
7.8
6.6
24.9
24.8
4.9
4.3
HUL
Neutral
830
-
179,578
35,252
38,495
17.8
17.8
20.7
22.4
40.2
37.1
38.4
32.9
95.6
88.9
5.0
4.5
ITC
Buy
235
284
284,026
40,059
44,439
38.3
39.2
9.0
10.1
26.2
23.2
7.3
6.4
27.8
27.5
6.5
5.9
Marico
Buy
252
300
32,487
6,430
7,349
18.8
19.5
6.4
7.7
39.3
32.7
11.9
10.0
33.2
32.5
4.9
4.2
Nestle*
Neutral
6,327
-
61,007
10,073
11,807
20.7
21.5
124.8
154.2
50.7
41.0
20.8
18.7
34.8
36.7
5.9
5.0
Tata Global
Neutral
123
-
7,785
8,675
9,088
9.8
9.8
7.4
8.2
16.7
15.0
1.9
1.8
7.9
8.1
0.8
0.8
Stock Watch
December 14, 2016
Company Name
Reco
CMP
Target
Mkt Cap
Sales ( Čcr )
OPM(%)
EPS (Č)
PER(x)
P/BV(x)
RoE(%)
EV/Sales(x)
(Č)
Price ( Č)
( Č cr )
FY17E FY18E
FY17E
FY18E
FY17E
FY18E
FY17E
FY18E
FY17E
FY18E
FY17E
FY18E
FY17E
FY18E
FMCG
Procter & Gamble
Accumulate
6,800
7,369
22,073
2,939
3,342
23.2
23.0
146.2
163.7
46.5
41.5
104.1
99.9
25.3
23.5
7.0
6.1
Hygiene
IT
HCL Tech^
Buy
800
1,000
112,825
49,242
57,168
20.5
20.5
55.7
64.1
14.4
12.5
2.9
2.2
20.3
17.9
2.2
1.7
Infosys
Buy
990
1,249
227,409
68,350
77,326
27.0
27.0
62.5
69.4
15.8
14.3
3.4
3.1
21.3
21.6
2.7
2.4
TCS
Buy
2,201
2,620
433,662
119,025
133,308
27.6
27.6
131.2
145.5
16.8
15.1
5.4
5.0
32.4
33.1
3.4
3.0
Tech Mahindra
Buy
484
600
46,987
29,673
32,937
15.5
17.0
32.8
39.9
14.8
12.1
2.9
2.5
19.6
20.7
1.3
1.1
Wipro
Buy
464
590
112,689
55,440
60,430
18.1
18.1
35.9
39.9
12.9
11.6
2.3
2.1
19.0
19.3
1.7
1.6
Media
D B Corp
Neutral
361
-
6,633
2,297
2,590
27.4
28.2
21.0
23.4
17.2
15.4
4.0
3.5
23.7
23.1
2.7
2.3
HT Media
Neutral
73
-
1,708
2,693
2,991
12.6
12.9
7.9
9.0
9.3
8.2
0.8
0.7
7.8
8.3
0.2
0.1
Jagran Prakashan
Buy
170
225
5,562
2,355
2,635
28.0
28.0
10.8
12.5
15.8
13.6
3.4
3.0
21.7
21.7
2.4
2.1
Sun TV Network
Neutral
496
-
19,558
2,850
3,265
70.1
71.0
26.2
30.4
18.9
16.3
4.9
4.3
24.3
25.6
6.5
5.5
Hindustan Media
Neutral
267
-
1,957
1,016
1,138
24.3
25.2
27.3
30.1
9.8
8.9
1.9
1.7
16.2
15.8
1.2
1.1
Ventures
TV Today Network
Buy
281
385
1,678
637
743
27.5
27.5
18.4
21.4
15.3
13.2
2.7
2.3
17.4
17.2
2.3
1.9
Metals & Mining
Coal India
Neutral
306
-
193,123
84,638
94,297
21.4
22.3
24.5
27.1
12.5
11.3
5.2
5.0
42.6
46.0
1.8
1.6
Hind. Zinc
Neutral
278
-
117,464
14,252
18,465
55.9
48.3
15.8
21.5
17.6
12.9
2.9
2.5
17.0
20.7
8.3
6.4
Hindalco
Neutral
177
-
36,478
107,899
112,095
7.4
8.2
9.2
13.0
19.2
13.6
0.9
0.9
4.8
6.6
0.9
0.8
JSW Steel
Neutral
1,632
-
39,453
53,201
58,779
16.1
16.2
130.6
153.7
12.5
10.6
1.7
1.5
14.0
14.4
1.5
1.3
NMDC
Neutral
128
-
40,577
6,643
7,284
44.4
47.7
7.1
7.7
18.1
16.7
1.6
1.5
8.8
9.2
3.9
3.5
SAIL
Neutral
54
-
22,323
47,528
53,738
(0.7)
2.1
(1.9)
2.6
20.8
0.6
0.6
(1.6)
3.9
1.3
1.2
Vedanta
Neutral
240
-
71,138
71,744
81,944
19.2
21.7
13.4
20.1
17.9
11.9
1.5
1.4
8.4
11.3
1.4
1.1
Tata Steel
Neutral
421
-
40,854
121,374
121,856
7.2
8.4
18.6
34.3
22.6
12.3
1.4
1.3
6.1
10.1
1.0
1.0
Oil & Gas
Cairn India
Neutral
263
-
49,215
9,127
10,632
4.3
20.6
8.8
11.7
29.8
22.4
1.0
0.9
3.3
4.2
6.9
5.8
GAIL
Neutral
424
-
53,796
56,220
65,198
9.3
10.1
27.1
33.3
15.7
12.7
1.4
1.3
9.3
10.7
1.2
1.0
ONGC
Neutral
312
-
266,803
137,222
152,563
15.0
21.8
19.5
24.1
16.0
12.9
1.4
1.3
8.5
10.1
2.2
2.0
Indian Oil Corp
Neutral
301
-
146,163
373,359
428,656
5.9
5.5
54.0
59.3
5.6
5.1
0.9
0.8
16.0
15.6
0.5
0.5
Reliance Industries
Neutral
1,040
-
337,182
301,963
358,039
12.1
12.6
87.7
101.7
11.9
10.2
1.2
1.1
10.7
11.3
1.6
1.3
Pharmaceuticals
Alembic Pharma
Neutral
625
-
11,775
3,483
4,083
20.2
21.4
24.3
30.4
25.7
20.6
5.9
4.7
25.5
25.3
3.4
2.8
Alkem Laboratories Ltd
Buy
1,640
1,989
19,609
6,043
6,893
18.7
19.3
80.5
88.8
20.4
18.5
4.5
3.8
22.3
20.3
3.2
2.7
Aurobindo Pharma
Buy
718
877
42,027
15,720
18,078
23.7
23.7
41.4
47.3
17.4
15.2
4.5
3.5
29.6
26.1
2.9
2.5
Aventis*
Neutral
4,284
-
9,867
2,277
2,597
17.3
18.3
149.4
172.0
28.7
24.9
4.8
3.8
25.1
28.8
4.0
3.3
Stock Watch
December 14, 2016
Company Name
Reco
CMP
Target
Mkt Cap
Sales ( Čcr )
OPM(%)
EPS (Č)
PER(x)
P/BV(x)
RoE(%)
EV/Sales(x)
(Č)
Price ( Č)
( Č cr )
FY17E FY18E
FY17E
FY18E
FY17E
FY18E
FY17E
FY18E
FY17E
FY18E
FY17E
FY18E
FY17E
FY18E
Pharmaceuticals
Cadila Healthcare
Neutral
383
-
39,245
10,429
12,318
22.6
22.0
16.9
19.2
22.7
20.0
5.8
4.6
28.5
25.7
3.8
3.1
Cipla
Reduce
578
490
46,462
15,378
18,089
17.4
18.4
21.6
27.2
26.8
21.3
3.5
3.0
13.7
15.2
3.2
2.7
Dr Reddy's
Neutral
3,165
-
52,442
16,043
18,119
20.8
22.4
112.4
142.9
28.2
22.2
3.8
3.3
14.1
15.9
3.2
2.8
Dishman Pharma
Neutral
226
-
3,644
1,718
1,890
22.7
22.8
9.5
11.3
23.8
20.0
2.3
2.1
10.1
10.9
2.6
2.3
GSK Pharma*
Neutral
2,730
-
23,124
3,000
3,312
15.4
20.6
46.5
60.8
58.7
44.9
14.1
14.0
26.3
30.6
7.5
6.8
Indoco Remedies
Reduce
261
240
2,408
1,112
1,289
16.2
18.2
11.6
16.0
22.5
16.3
3.6
3.0
17.0
20.1
2.2
1.9
Ipca labs
Accumulate
540
613
6,816
3,303
3,799
15.3
15.3
17.3
19.7
31.2
27.4
2.7
2.5
9.1
9.4
2.2
1.9
Lupin
Buy
1,492
1,809
67,270
15,912
18,644
26.4
26.7
58.1
69.3
25.7
21.5
5.0
4.1
21.4
20.9
4.3
3.6
Sun Pharma
Buy
683
847
164,377
31,129
35,258
32.0
32.9
30.2
35.3
22.6
19.4
3.7
3.0
20.0
20.1
4.8
4.0
Power
Tata Power
Neutral
78
-
20,988
36,916
39,557
17.4
27.1
5.1
6.3
15.2
12.3
1.3
1.2
9.0
10.3
1.6
1.4
NTPC
Neutral
165
-
135,968
86,605
95,545
17.5
20.8
11.8
13.4
14.0
12.3
1.4
1.3
10.5
11.1
2.9
2.9
Power Grid
Buy
185
223
96,889
25,315
29,193
88.2
88.7
14.2
17.2
13.1
10.8
2.0
1.7
15.2
16.1
8.5
7.6
Real Estate
Prestige Estate
Buy
158
210
5,929
4,707
5,105
25.2
26.0
10.3
13.0
15.4
12.2
1.2
1.1
10.3
10.2
2.4
2.1
MLIFE
Buy
366
522
1,500
1,152
1,300
22.7
24.6
29.9
35.8
12.2
10.2
0.9
0.9
7.6
8.6
2.0
1.7
Telecom
Bharti Airtel
Neutral
330
-
131,854
105,086
114,808
34.5
34.7
12.2
16.4
27.0
20.1
1.8
1.7
6.8
8.4
2.2
1.9
Idea Cellular
Neutral
77
-
27,708
40,133
43,731
37.2
37.1
6.4
6.5
12.0
11.8
1.0
0.9
8.2
7.6
1.7
1.4
zOthers
Abbott India
Neutral
4,721
-
10,032
3,153
3,583
14.1
14.4
152.2
182.7
31.0
25.8
152.3
130.1
25.6
26.1
2.9
2.5
Asian Granito
Buy
214
351
642
1,071
1,182
12.1
12.4
12.7
16.0
16.8
13.4
1.6
1.4
9.5
10.7
0.9
0.8
Bajaj Electricals
Buy
218
274
2,201
4,801
5,351
5.7
6.2
10.4
13.7
20.9
15.9
2.6
2.3
12.4
14.5
0.5
0.4
Banco Products (India)
Neutral
191
-
1,366
1,353
1,471
12.3
12.4
14.5
16.3
13.2
11.7
18.2
16.4
14.5
14.6
0.9
99.5
Coffee Day Enterprises
Neutral
200
-
4,121
2,964
3,260
20.5
21.2
4.7
8.0
-
25.0
2.3
2.1
5.5
8.5
1.8
1.6
Ltd
Competent Automobiles Neutral
170
-
105
1,137
1,256
3.1
2.7
28.0
23.6
6.1
7.2
32.7
29.6
14.3
11.5
0.1
0.1
Elecon Engineering
Neutral
61
-
687
1,482
1,660
13.7
14.5
3.9
5.8
15.7
10.6
3.7
3.4
7.8
10.9
0.8
0.7
Finolex Cables
Neutral
419
-
6,410
2,883
3,115
12.0
12.1
14.2
18.6
29.5
22.5
15.7
13.7
15.8
14.6
2.0
1.8
Garware Wall Ropes
Neutral
645
-
1,412
873
938
14.3
14.3
35.2
37.5
18.4
17.2
3.2
2.7
17.5
15.9
1.5
1.4
Goodyear India*
Neutral
722
-
1,666
1,598
1,704
10.4
10.2
49.4
52.6
14.6
13.7
67.5
59.2
18.2
17.0
0.7
101.8
Hitachi
Neutral
1,496
-
4,067
2,081
2,433
8.8
8.9
33.4
39.9
44.8
37.5
36.1
30.1
22.1
21.4
1.9
1.6
HSIL
Neutral
282
-
2,036
2,384
2,515
15.8
16.3
15.3
19.4
18.4
14.5
18.3
15.7
7.8
9.3
1.0
0.9
Interglobe Aviation
Neutral
816
-
29,414
21,122
26,005
14.5
27.6
110.7
132.1
7.4
6.2
44.1
31.5
168.5
201.1
1.4
1.1
Stock Watch
December 14, 2016
Company Name
Reco
CMP
Target
Mkt Cap
Sales ( Čcr )
OPM(%)
EPS (Č)
PER(x)
P/BV(x)
RoE(%)
EV/Sales(x)
(Č)
Price ( Č)
( Č cr )
FY17E
FY18E
FY17E
FY18E
FY17E
FY18E
FY17E
FY18E
FY17E
FY18E
FY17E
FY18E
FY17E
FY18E
zOthers
Jyothy Laboratories
Neutral
370
-
6,726
1,440
2,052
11.5
13.0
8.5
10.0
43.6
37.0
10.6
9.8
18.6
19.3
4.9
3.4
Kirloskar Engines India
Neutral
325
-
4,700
2,554
2,800
9.9
10.0
10.5
12.1
31.0
26.9
13.0
12.2
10.7
11.7
1.5
1.3
Ltd
Linc Pen & Plastics
Neutral
232
-
343
382
420
9.3
9.5
13.5
15.7
17.2
14.8
3.0
2.6
17.1
17.3
1.0
0.9
M M Forgings
Neutral
441
-
532
546
608
20.4
20.7
41.3
48.7
10.7
9.1
60.4
53.5
16.6
17.0
0.8
0.7
Manpasand Bever.
Neutral
569
-
3,256
836
1,087
19.6
19.4
16.9
23.8
33.7
23.9
4.0
3.5
12.0
14.8
3.5
2.6
Mirza International
Buy
83
107
997
987
1,106
18.0
18.0
6.5
7.6
12.7
10.9
2.1
1.7
15.9
15.7
1.2
1.1
MT Educare
Neutral
122
-
486
366
417
17.7
18.2
9.4
10.8
13.0
11.3
2.9
2.5
22.2
22.3
1.2
1.1
Narayana Hrudaya
Neutral
337
-
6,888
1,873
2,166
11.5
11.7
2.6
4.0
127.4
85.0
7.8
7.1
6.1
8.3
3.8
3.3
Navkar Corporation
Buy
175
265
2,496
369
561
42.9
42.3
7.2
11.5
24.2
15.2
1.8
1.6
7.4
10.5
7.9
5.2
Navneet Education
Neutral
109
-
2,604
1,062
1,147
24.0
24.0
6.1
6.6
17.9
16.5
3.7
3.3
20.6
19.8
2.5
2.3
Nilkamal
Neutral
1,332
-
1,988
1,995
2,165
10.7
10.4
69.8
80.6
19.1
16.5
76.1
66.1
16.6
16.5
1.0
0.9
Page Industries
Neutral
13,656
-
15,231
2,450
3,124
20.1
17.6
299.0
310.0
45.7
44.1
304.1
232.2
47.1
87.5
6.2
4.9
Parag Milk Foods
Neutral
274
-
2,303
1,919
2,231
9.3
9.6
9.5
12.9
29.0
21.2
4.5
3.7
15.5
17.5
1.4
1.2
Quick Heal
Neutral
274
-
1,917
408
495
27.3
27.0
7.7
8.8
35.4
31.1
3.3
3.3
9.3
10.6
4.0
3.3
Radico Khaitan
Buy
120
147
1,595
1,667
1,824
13.0
13.2
6.7
8.2
18.0
14.6
1.6
1.5
9.0
10.2
1.3
1.2
Relaxo Footwears
Neutral
416
-
4,991
2,085
2,469
9.2
8.2
7.6
8.0
55.0
52.3
21.3
18.2
17.9
18.8
2.4
2.1
S H Kelkar & Co.
Neutral
309
-
4,471
1,036
1,160
15.1
15.0
6.1
7.2
50.6
43.1
5.4
5.0
10.7
11.5
4.0
3.6
Siyaram Silk Mills
Accumulate
1,245
1,605
1,167
1,733
1,948
11.6
11.7
96.6
114.7
12.9
10.9
2.0
1.7
15.3
15.7
0.9
0.8
Styrolution ABS India*
Neutral
583
-
1,025
1,440
1,537
9.2
9.0
40.6
42.6
14.4
13.7
36.7
33.3
12.3
11.6
0.7
0.6
Surya Roshni
Neutral
182
-
798
3,342
3,625
7.8
7.5
17.3
19.8
10.5
9.2
20.0
16.1
10.5
10.8
0.5
0.5
Team Lease Serv.
Neutral
872
-
1,491
3,229
4,001
1.5
1.8
22.8
32.8
38.3
26.6
4.1
3.6
10.7
13.4
0.4
0.3
The Byke Hospitality
Neutral
172
-
689
287
384
20.5
20.5
7.6
10.7
22.6
16.1
4.7
3.8
20.7
23.5
2.3
1.7
Transport Corporation of
Neutral
180
-
1,376
2,671
2,911
8.5
8.8
13.9
15.7
13.0
11.5
1.8
1.6
13.7
13.8
0.6
0.6
India
TVS Srichakra
Neutral
3,484
-
2,668
2,304
2,614
13.7
13.8
231.1
266.6
15.1
13.1
391.5
308.2
33.9
29.3
1.2
1.0
UFO Moviez
Neutral
427
-
1,178
619
685
33.2
33.4
30.0
34.9
14.2
12.2
2.0
1.7
13.8
13.9
1.6
1.3
Visaka Industries
Neutral
191
-
304
1,051
1,138
10.3
10.4
21.0
23.1
9.1
8.3
24.5
23.0
9.0
9.2
0.6
0.5
VRL Logistics
Neutral
268
-
2,444
1,902
2,119
16.7
16.6
14.6
16.8
18.4
15.9
4.0
3.5
21.9
22.2
1.4
1.2
Wonderla Holidays
Neutral
327
-
1,846
287
355
38.0
40.0
11.3
14.2
28.9
23.0
4.1
3.6
21.4
23.9
6.3
5.1
Source: Company, Angel Research; Note: *December year end; #September year end; &October year end; Price as on December 13, 2016
Market Outlook
December 14, 2016
Research Team Tel: 022 - 39357800
DISCLAIMER
Angel Broking Private Limited (hereinafter referred to as “Angel”) is a registered Member of National Stock Exchange of India
Limited,Bombay Stock Exchange Limited and Metropolitan Stock Exchange Limited. It is also registered as a Depository Participant with
CDSL and Portfolio Manager with SEBI. It also has registration with AMFI as a Mutual Fund Distributor. Angel Broking Private Limited is a
registered entity with SEBI for Research Analyst in terms of SEBI (Research Analyst) Regulations, 2014 vide registration number
INH000000164. Angel or its associates has not been debarred/ suspended by SEBI or any other regulatory authority for accessing
/dealing in securities Market. Angel or its associates/analyst has not received any compensation / managed or
co-managed public offering of securities of the company covered by Analyst during the past twelve months.
This document is solely for the personal information of the recipient, and must not be singularly used as the basis of any investment
decision. Nothing in this document should be construed as investment or financial advice. Each recipient of this document should make
such investigations as they deem necessary to arrive at an independent evaluation of an investment in the securities of the companies
referred to in this document (including the merits and risks involved), and should consult their own advisors to determine the merits and
risks of such an investment.
Reports based on technical and derivative analysis center on studying charts of a stock's price movement, outstanding positions and
trading volume, as opposed to focusing on a company's fundamentals and, as such, may not match with a report on a company's
fundamentals. Investors are advised to refer the Fundamental and Technical Research Reports available on our website to evaluate the
contrary view, if any.
The information in this document has been printed on the basis of publicly available information, internal data and other reliable
sources believed to be true, but we do not represent that it is accurate or complete and it should not be relied on as such, as this
document is for general guidance only. Angel Broking Pvt. Limited or any of its affiliates/ group companies shall not be in any way
responsible for any loss or damage that may arise to any person from any inadvertent error in the information contained in this report.
Angel Broking Pvt. Limited has not independently verified all the information contained within this document. Accordingly, we cannot
testify, nor make any representation or warranty, express or implied, to the accuracy, contents or data contained within this document.
While Angel Broking Pvt. Limited endeavors to update on a reasonable basis the information discussed in this material, there may be
regulatory, compliance, or other reasons that prevent us from doing so.
This document is being supplied to you solely for your information, and its contents, information or data may not be reproduced,
redistributed or passed on, directly or indirectly.
Neither Angel Broking Pvt. Limited, nor its directors, employees or affiliates shall be liable for any loss or damage that may arise from
or in connection with the use of this information.